Today’s Office for National Statistics’ latest figures are in for July 2025. This gives a real insight into what the property market looks like in the UK. We have summarised the key statistics for an easy overview of the UK property market (below).
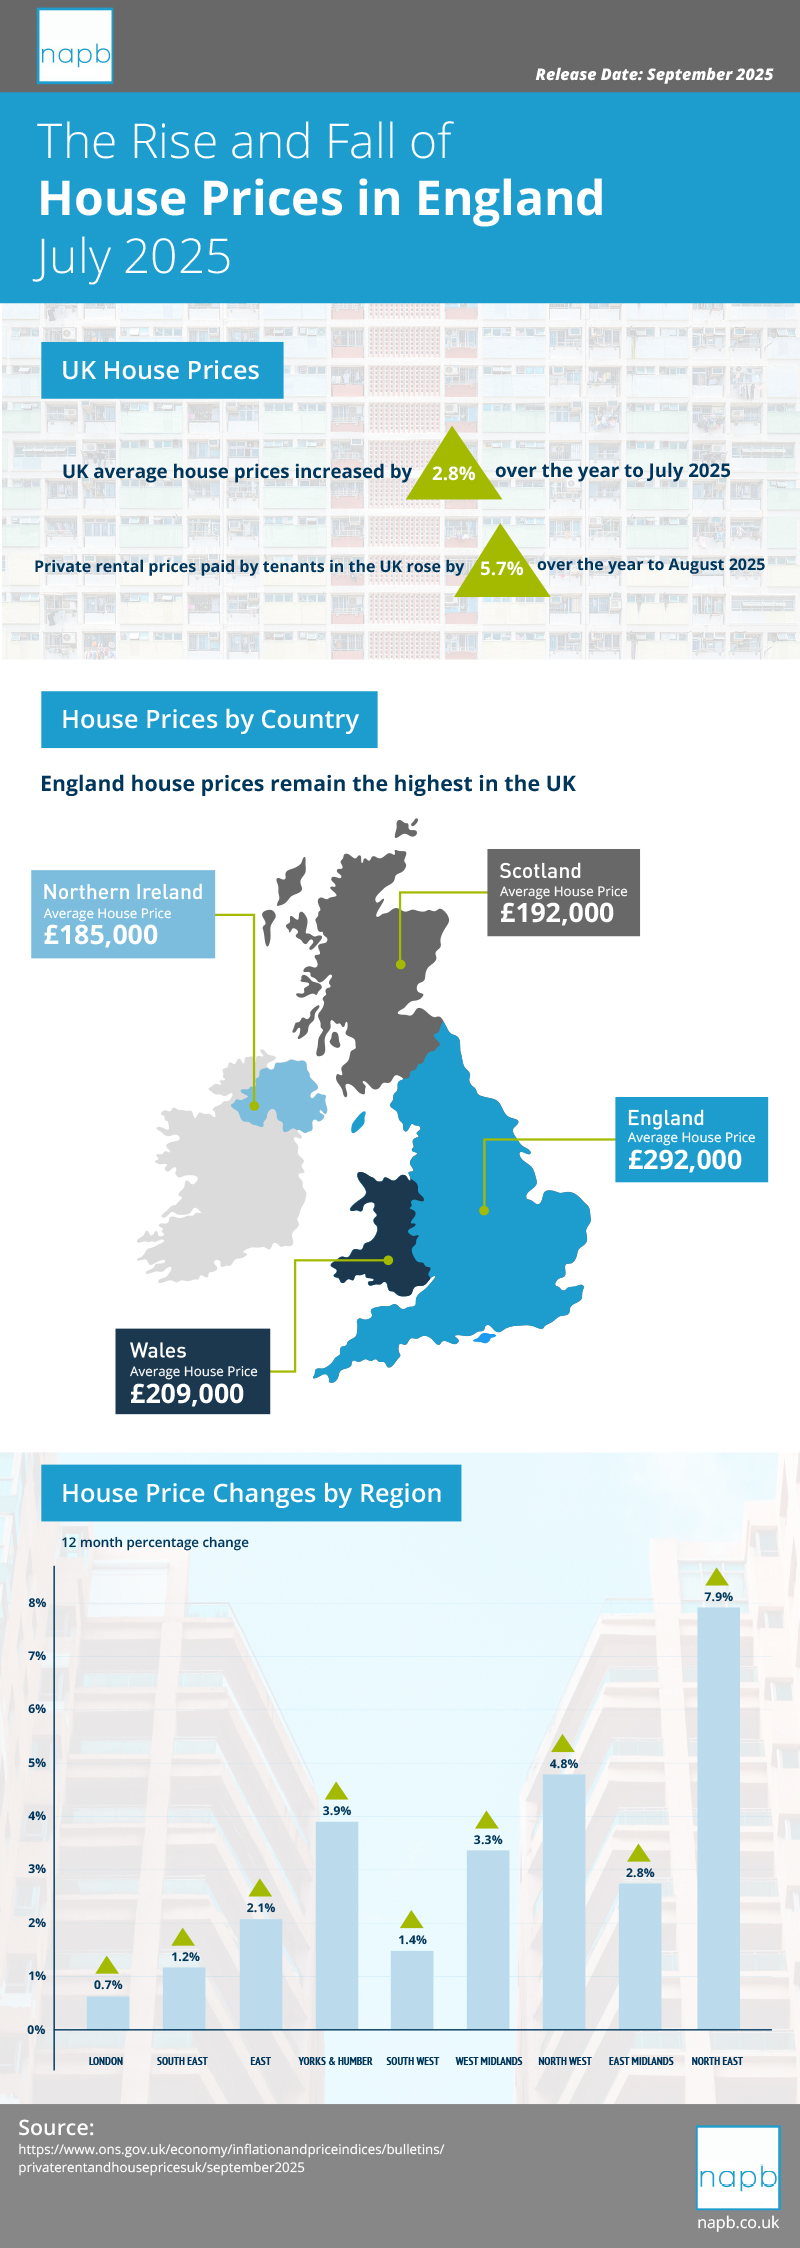
Average UK house prices increased by 2.8%, to £270,000, in the 12 months to July 2025 (provisional estimate); this annual growth rate is down from 3.6%, in the 12 months to June 2025.
Average UK monthly private rents increased by 5.7%, to £1,348, in the 12 months to August 2025 (provisional estimate); this annual growth rate is down from 5.9% in the 12 months to July 2025.
The North East was the English region with the highest house price inflation, at 7.9%, in the 12 months to July 2025. This was up from 7.7% in the 12 months to June 2025.
Annual house price inflation was lowest in London, at 0.7%, in the 12 months to July 2025. This was down from 0.9% in the 12 months to June 2025.